Business Intelligence Dashboards & Real-Time KPIs
Turn your scattered operation data into clear, actionable visualizations. Real-time KPIs, automatic alerts and reports that take minutes, not days.
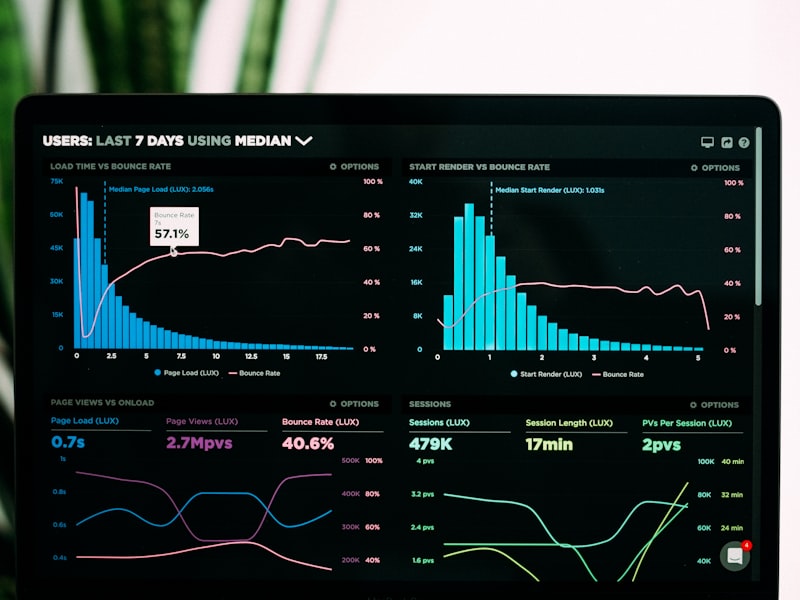
Your operation data, visible in real time
Most industrial companies have data: in the ERP, in the MES, in Excel sheets someone updates every shift, and in systems that were never meant to communicate with each other. The problem isn't a lack of information — it's that information arrives late, is scattered and requires hours of manual consolidation to produce a report that's already obsolete when the director or plant manager reads it.
We develop dashboards and Business Intelligence platforms connected directly to your data sources: relational databases, ERP and MES APIs, operational Excel files, legacy systems and cloud platforms. The result is a centralized panel where key indicators — OEE, quality, inventory, sales, maintenance — update automatically and are available on desktop, tablet and mobile without manual reports.
For companies in Reynosa and Tamaulipas, the most implemented dashboards include production boards by shift and line, quality indicators with defect traceability, preventive and corrective maintenance KPIs, and sales pipelines with real-time forecast. Each dashboard is built with configurable alerts that notify the relevant team when an indicator falls outside the defined range, before the deviation becomes a major problem.
What's included?
Real-Time Dashboards
Dynamic visualizations that update automatically with the latest data from your operation.
Multiple Data Sources
We connect with databases, APIs, Excel, ERP, MES and any system where your data lives.
KPIs & Alerts
Define key indicators and receive notifications when a value exceeds or drops below defined thresholds.
Automatic Reports
Scheduled reports that are generated and sent by email without manual intervention.
Role-Based Access
Each user sees only the data and views that correspond to their area and hierarchy level.
Data Export
Download reports in Excel, PDF or CSV for presentations and external analysis.
Why choose us for this service?
Data-Driven Decisions
Replace instinct and manual reports with real, updated data.
Total Visibility
Production, sales, quality, finance and logistics on a single screen.
Proactive Alerts
Detect deviations before they become major problems.
Access from Anywhere
Your KPIs available on computer, tablet and phone at all times.
What you can visualize
Production OEE
Availability, performance and quality of your lines in real time.
Sales pipeline
Opportunities, conversion and updated forecast in one click.
Quality indicators
Defects by type, area and shift with historical trends.
Inventory & warehouse
Stock levels, rotation and automatic reorder alerts.
Financial KPIs
Billing, costs, margin and consolidated cash flow.
Equipment performance
MTBF, MTTR and availability of critical machinery.